
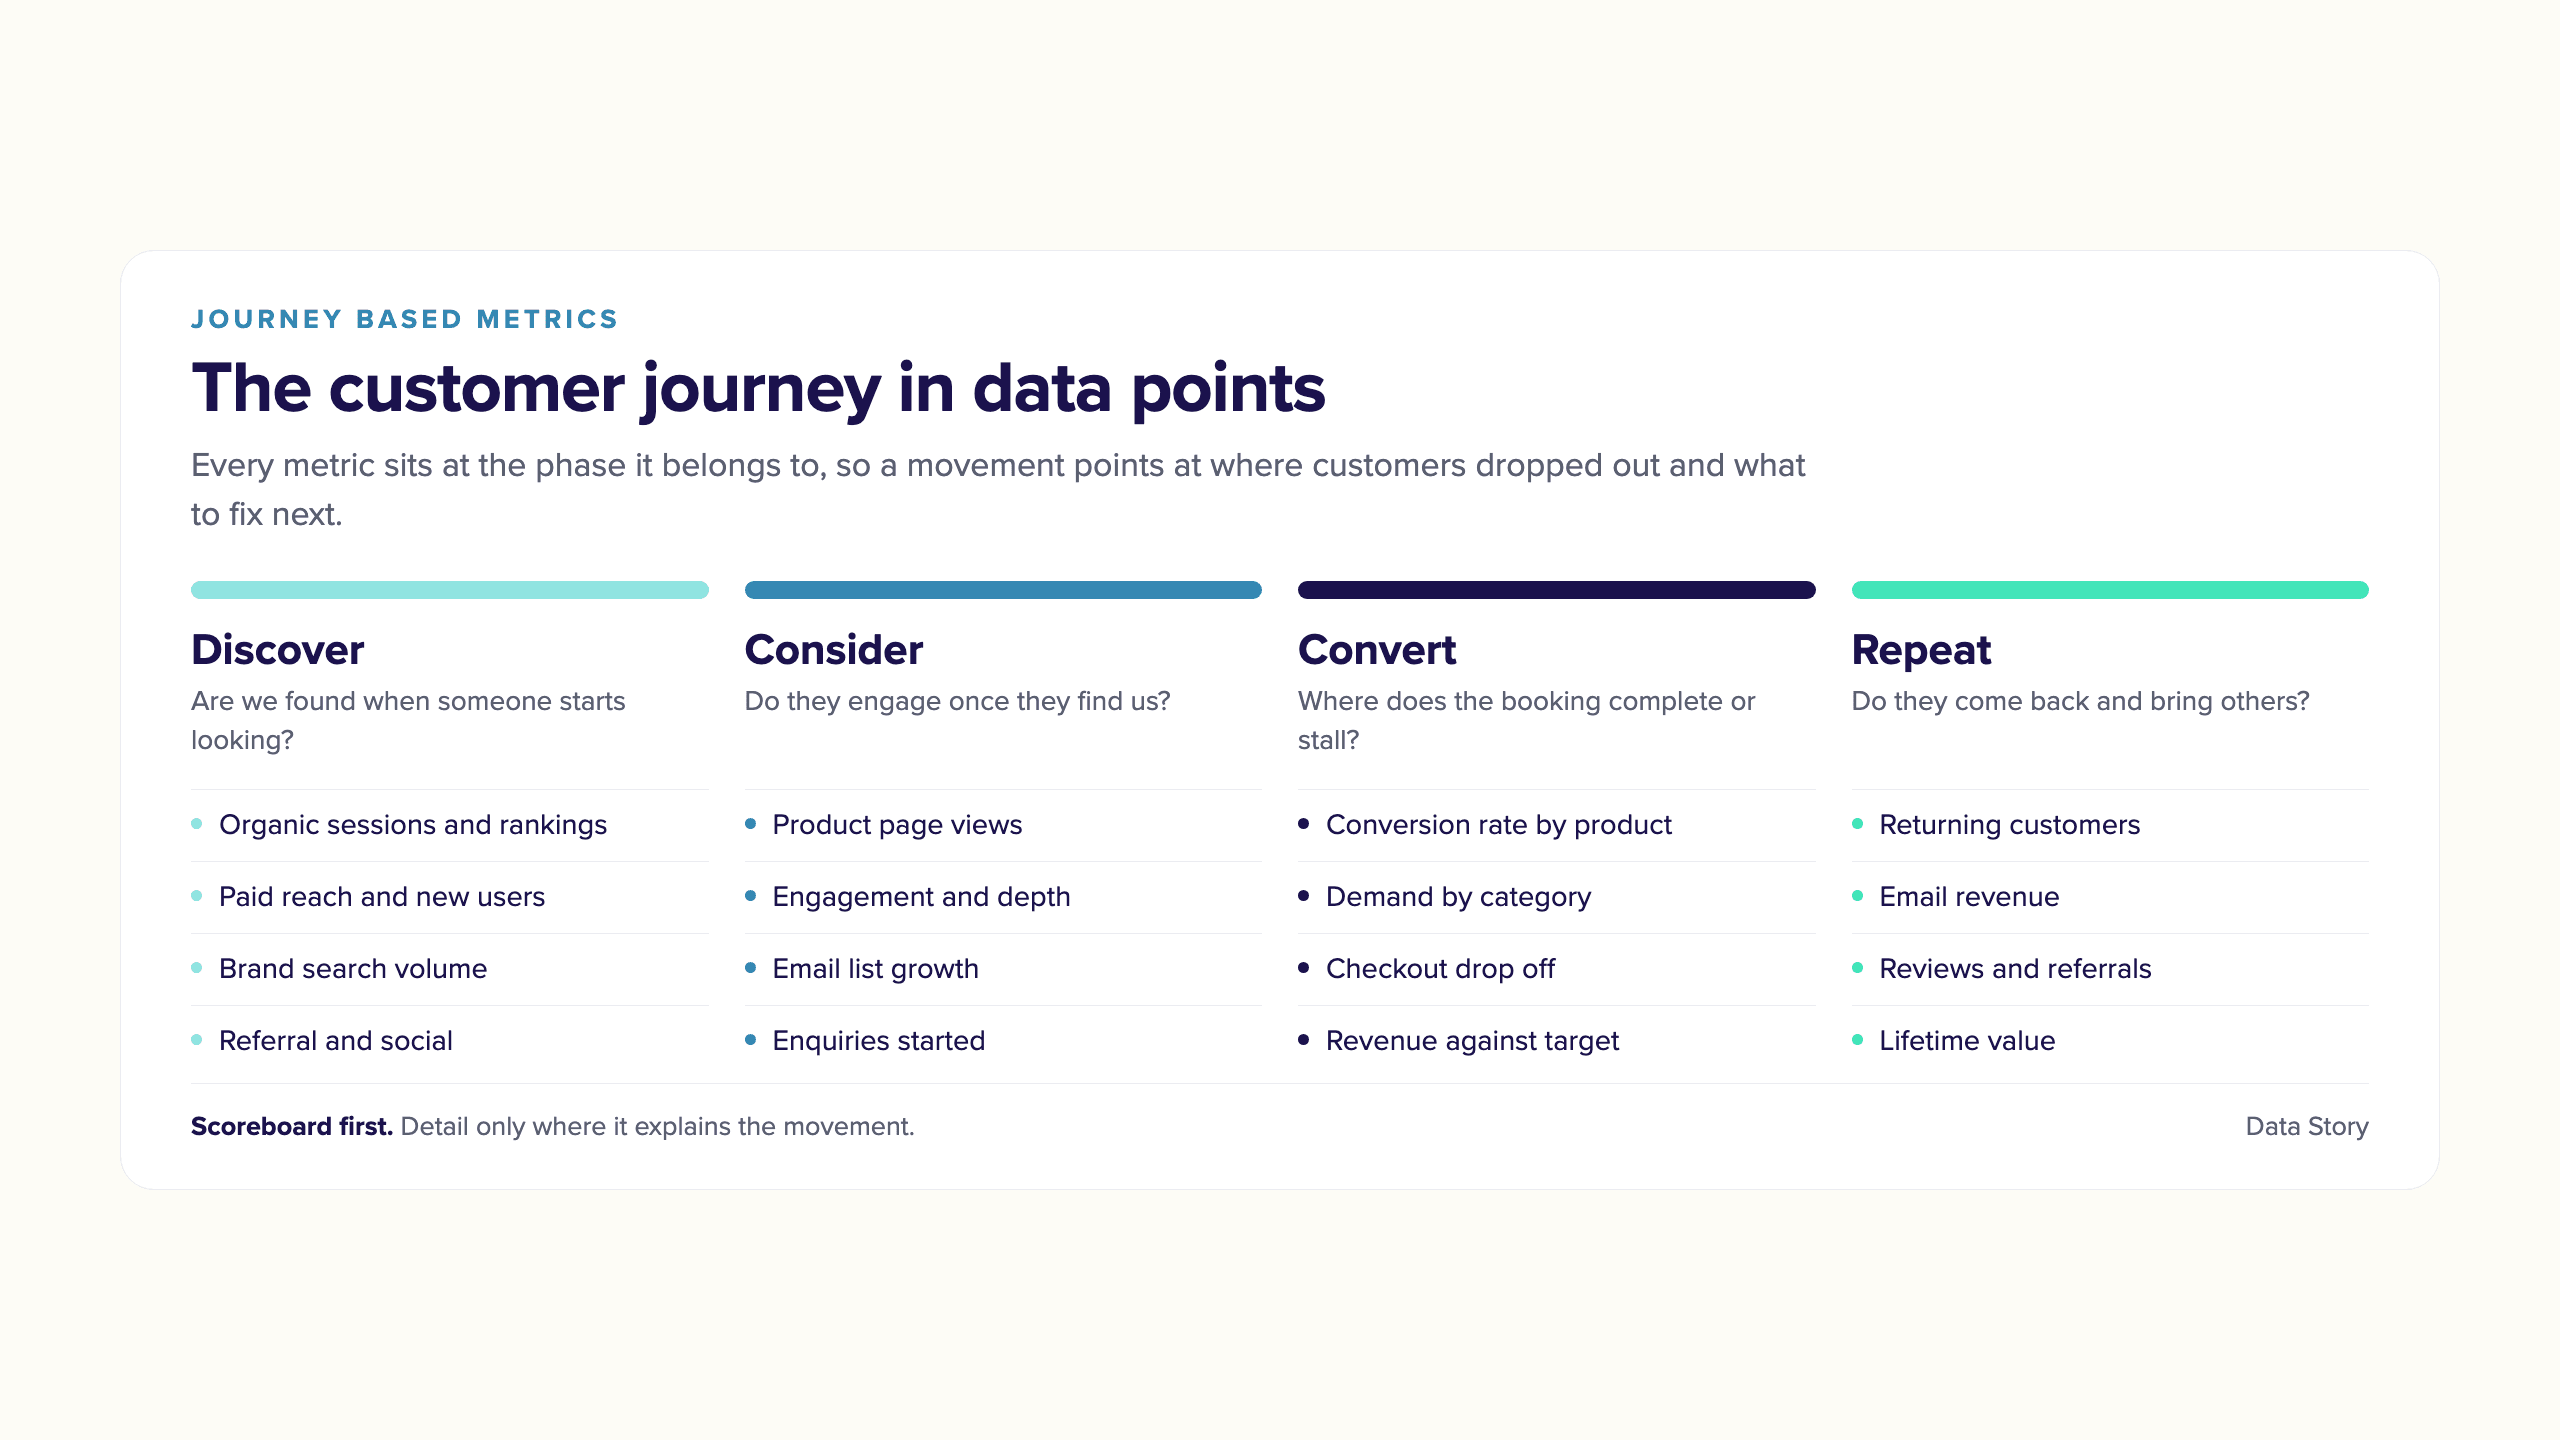
Every marketing team we work with has more data available than it can use and less clarity than it needs. Each platform reports its own version of the month, in its own definitions, and none of them describes the path a customer takes from first interest through to a completed booking. Our Journey Based measurement tool pulls the data points that map the customer journey.
Our clients say it better than we do:
"I describe it as our customer journey in data points, and tells us where the opportunity for growth and where drop off points are in the booking process (identify friction) in order to increase conversion at the end of the day."
We build it around the journey a customer takes, so every figure sits at a phase: discover, consider, convert, and everything that follows the sale.
Putting the figures in that order shows where people stop moving through the journey. If the same number of people arrive but fewer of them start a booking, the problem sits in the booking process, and more spend on awareness will not lift bookings.
"For me, our JBM reports on all of the important metrics that our typical business/board reporting doesn't... we couldn't rely only on the senior leadership reporting."
Conversion and demand, split by experience
"Breakdown by product/category is great because CR and demand is important to understand for every decision we make."
A single conversion rate covers everything you sell at once, which averages your strongest experience together with your weakest. One can hold that number steady for months while another declines underneath it.
Splitting demand and conversion by experience and category tells you which one to promote, which page to rebuild, and where price or availability is holding back something that would otherwise sell.
Organic performance is split the same way. Google Ads and Meta report only on the traffic you paid for, so organic sessions, rankings and search demand come from Search Console and analytics.
Figures you can quote in the room
"At the end of the day, the JBM report allows me to justify and back any commercial activity that we do and lobby for more budget/resources because the results are easily accessible and right in front of me. I can speak to it while I'm on the phone immediately and reel off fancy numbers 'off the top of my head' and in meetings. It's like my box of party tricks."
That comes from consistency. The same measures in the same order every month, so a marketing lead understands what each one means and what moves it.
The test worth running on your own report
Put three questions to your current monthly report. Where did customers drop out last month, what did conversion do across your strongest and weakest experience, and are you ahead or behind pace against the annual goal. If it answers all three, it is doing its job. If it answers one, that is the gap worth closing.
We set out the mechanics of building one, from fragmented platform data through to a single dashboard, in our guide to data led decision making.
Do you want Journey Based Metrics for your business?
We build the Journey Based Metrics report for every client we work with: your data, your experiences, your journey, in one place your team reads every month.
See how we do itRather talk it through first? Book a call. Want to keep up as the ground shifts? Get our newsletter.

Written by
Hannah Stuart
Head of Strategy
Hannah leads strategy at Data Story, working with clients to turn marketing data into growth roadmaps. She brings deep experience in full-funnel digital strategy, attribution modelling, and performance marketing across New Zealand and Australian markets.
LinkedInRelated articles

Destination and Experience
Your destination does not have an awareness problem
23 September 2026
How to tell whether awareness is your problem, and what to fix before you fund another campaign.
Read article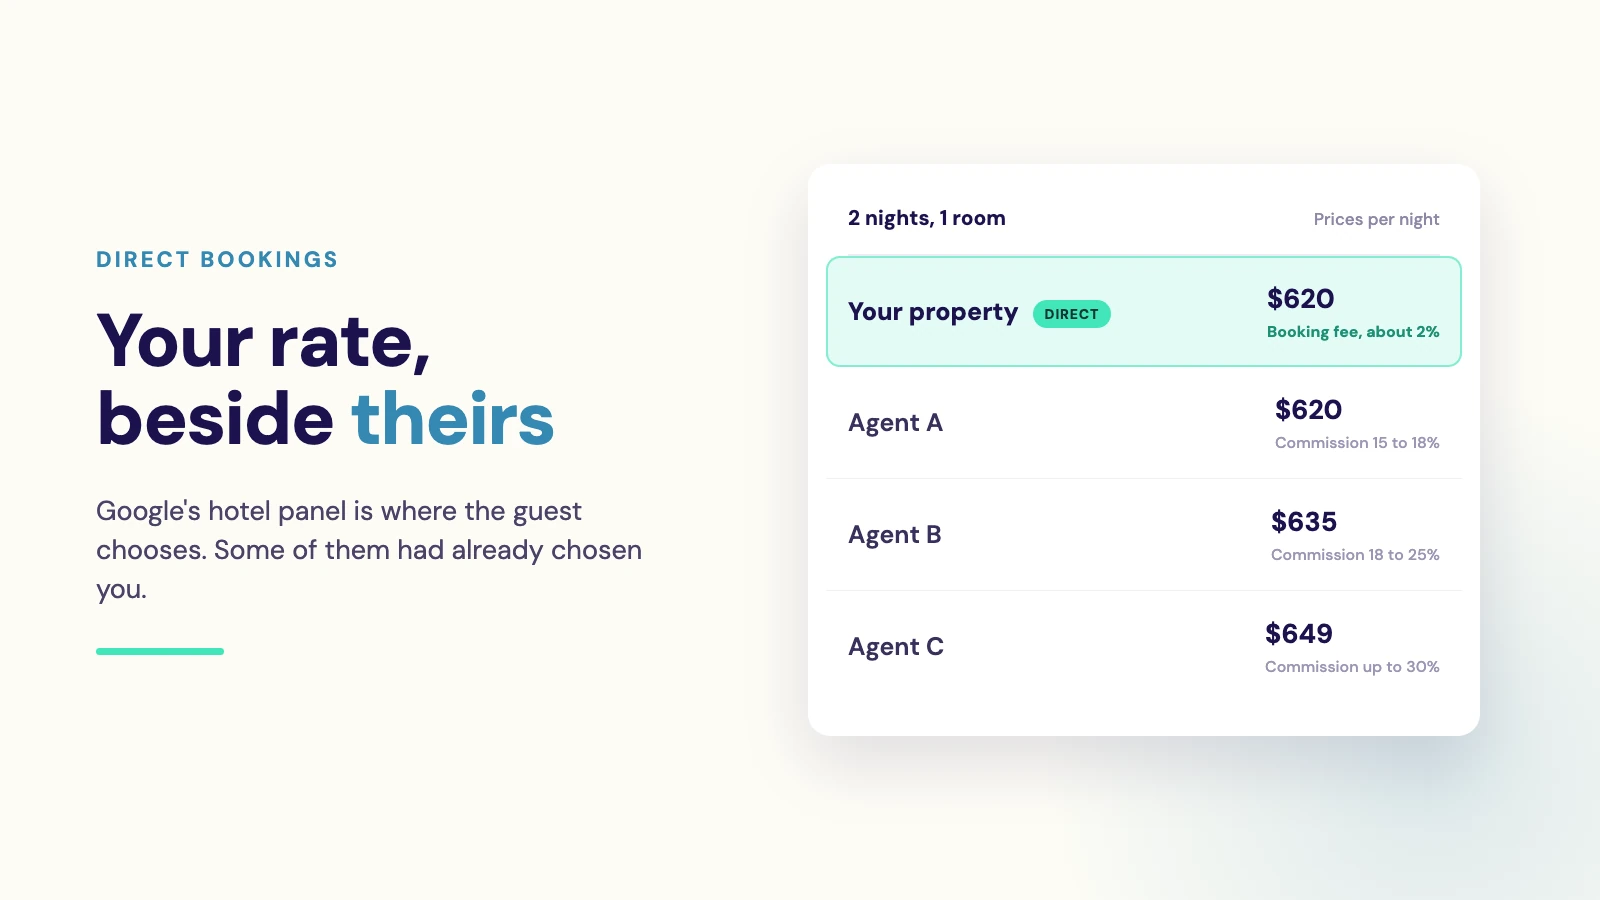
Paid Media
Why pay commission on guests you already won?
13 August 2026
Your brand, your reputation and your marketing earn the guest. Then the booking goes to an OTA, and the commission and the guest relationship go with it. How to use Google Hotel Ads to hold on to the booking, the relationship and the data.
Read article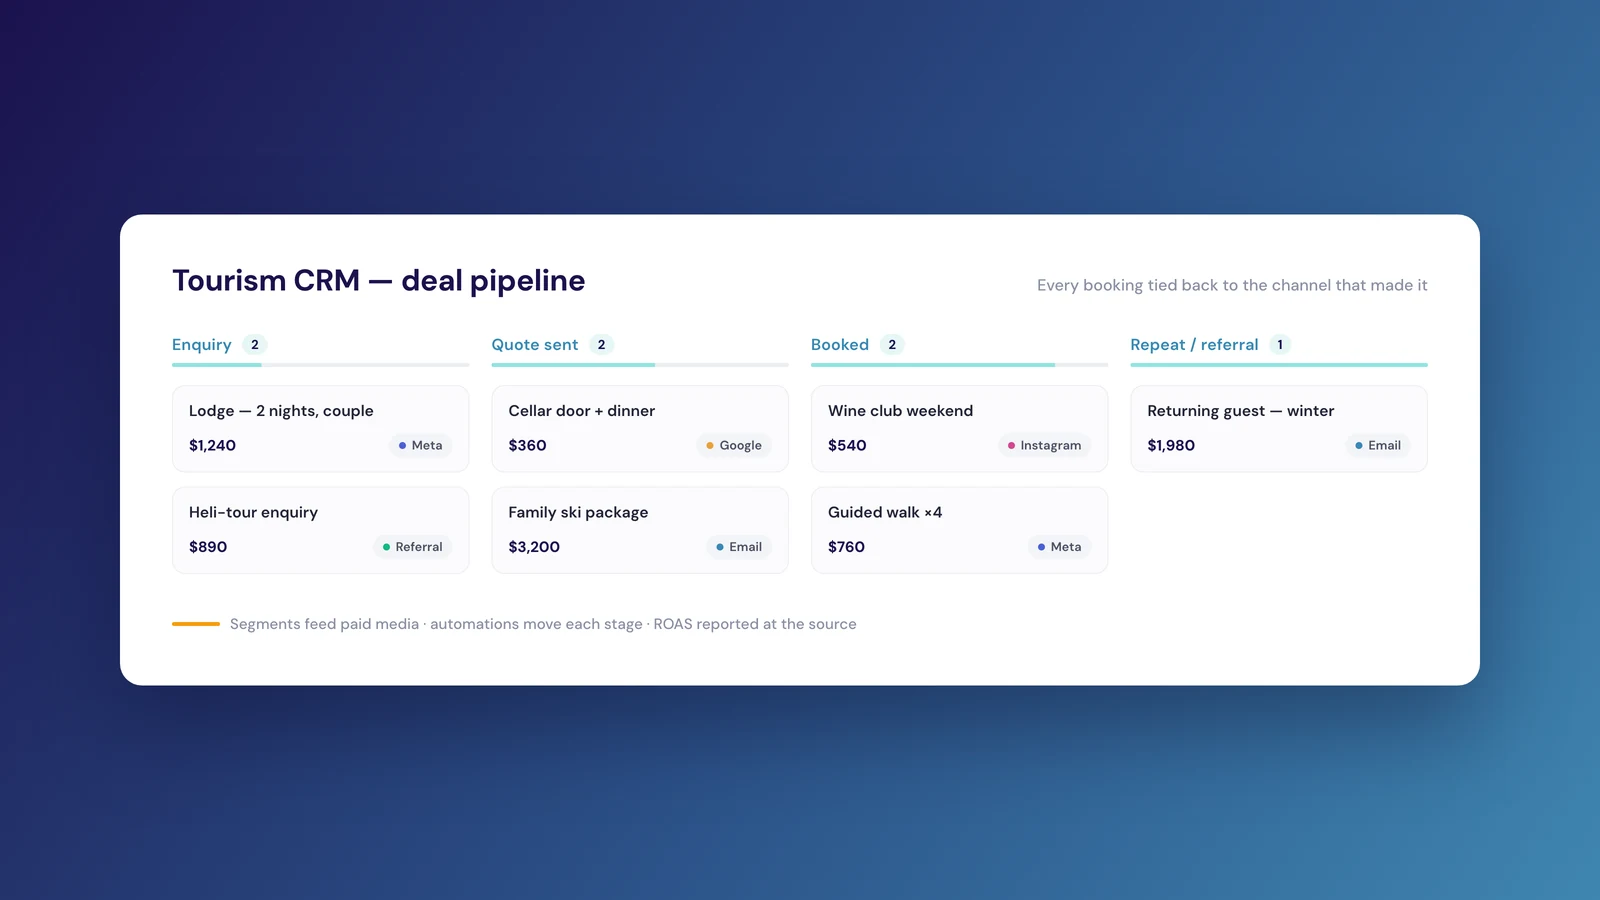
CRM
How we do CRM for destinations, experiences and tourism businesses
22 July 2026
For a tourism business, the difference between a CRM that holds contacts and one that drives revenue sits in a few specific places: attribution, audiences, automation and repeat bookings. How we refine each.
Read article