

What can your ads tell you when you look across platforms?
Say you're running the same creative on Meta, Google and TikTok. You can see its results in each ad account, but how does it compare across all three? What happens when you group related ads together? Or when you look at all your awareness, consideration and purchase campaigns across platforms, rather than one account at a time?
That's where useful patterns start to emerge. A creative may earn stronger engagement on one platform, while a particular market or your consideration campaigns may be absorbing spend without delivering the expected response. These aren't conclusions on their own, but they point us towards better questions, tests and budget decisions.
The challenge is bringing that activity together. Every platform has its own reporting structure, and inconsistent campaign, ad set and ad names make it harder to connect like-for-like activity. Our naming convention gives those records common fields, so we can compare a creative, group related ads or see how all your awareness, consideration or purchase campaigns are doing together.
We bring those fields together with performance data in BigQuery. It doesn't make attribution identical across platforms, and we still need to compare appropriate measures. But it gives us a much better way to move between the detail of an individual ad and the bigger picture of a campaign or customer journey.
The naming structure behind the comparison
Our campaign naming convention uses eight fields: market, brand, channel, objective, stage (awareness, consideration or purchase), product category, product item and period. For example, a fictional ski operator might use NZ | SkiCo-NorthPeak | PaidSocial | Conversions | Book | Pass | SeasonPass | 2026Winter.
The relevant fields stay consistent across platforms, while channel and objective reflect the campaign itself.
In BigQuery, these fields can be separated into columns so we can group spend and results by market, product or period.
With the data connected, we can compare an individual creative across platforms where it has been used, group related ad sets or campaigns, or roll results up to a market, a product or a stage such as awareness.
That gives us several levels of analysis rather than only a platform total. We still choose appropriate measures for each comparison: platform-reported bookings, for instance, may use different conversion definitions and attribution windows.
What do your awareness, consideration and purchase campaigns deliver?
Every campaign has one job: build awareness, help people consider you, or drive a purchase. For travel clients we call these Dream, Plan and Book.
Because every campaign name records its job, we can bring all Dream campaigns together, across platforms, and assess their combined spend, reach and engagement. We can do the same for Plan and Book using measures appropriate to each stage.
This shows how each part of the strategy is performing, although it doesn't track every customer through the journey.
We can then go deeper. If one stage is underperforming, is the change concentrated on one platform, in a particular market or among a group of ads? If the same creative is working differently across platforms, is that worth testing further?
Those are more useful starting points for budget and creative decisions than reviewing every ad account in isolation.
See how the same creative performs across platforms
A shared creative identifier lets us group uses of the same ad concept across platforms, provided we've recorded which assets and formats are genuinely equivalent. We also use versions (v1, v2) to identify copy changes and iterations (A, B) for images or video.
That means we can compare how a particular creative performed by platform and keep a record of what changed between tests. Differences in audience, placement and delivery still matter, so the result is a lead for further analysis, not proof that one platform caused the difference.
We also include the creation month, for example 202604 for April 2026. That makes it easier to find older creative that may need reviewing, such as an ad featuring a previous season's offer. Combined with a controlled test and its results, the naming record gives the next creative brief useful context. Ad-level information only appears in Google Analytics when the relevant tracking and reporting support it.
Start with your next campaign
Start with the next campaign. Agree a manageable set of fields and approved values for markets, products and campaign objectives, then use them consistently in names and tracking links. As connected data accumulates, you'll be better placed to build comparable views across platforms. The timing depends on the data sources and reporting setup.
For creative testing, record exactly what changes between versions and keep the other conditions as consistent as practical. The names help preserve a record of the test, while the results and test design determine what conclusions are reasonable.
Can you see every ad platform in one report?
If you check Meta, Google and TikTok one by one, you're doing the comparison by hand every month.
We set up the naming, the tracking and the reporting behind it, so every campaign you launch lands in one view from its first day.
See how we do itRather talk it through first? Book a call. Want to keep up as the ground shifts? Get our newsletter.

Written by
Arthur Davey
Performance and Insights Lead
Arthur heads up performance and analytics at Data Story. He specialises in GA4 implementation, custom dashboards, and extracting the insights that drive measurable marketing improvements. Arthur is the team's resident data detective — he finds the signal in the noise.
LinkedInRelated articles
SEO & GEO
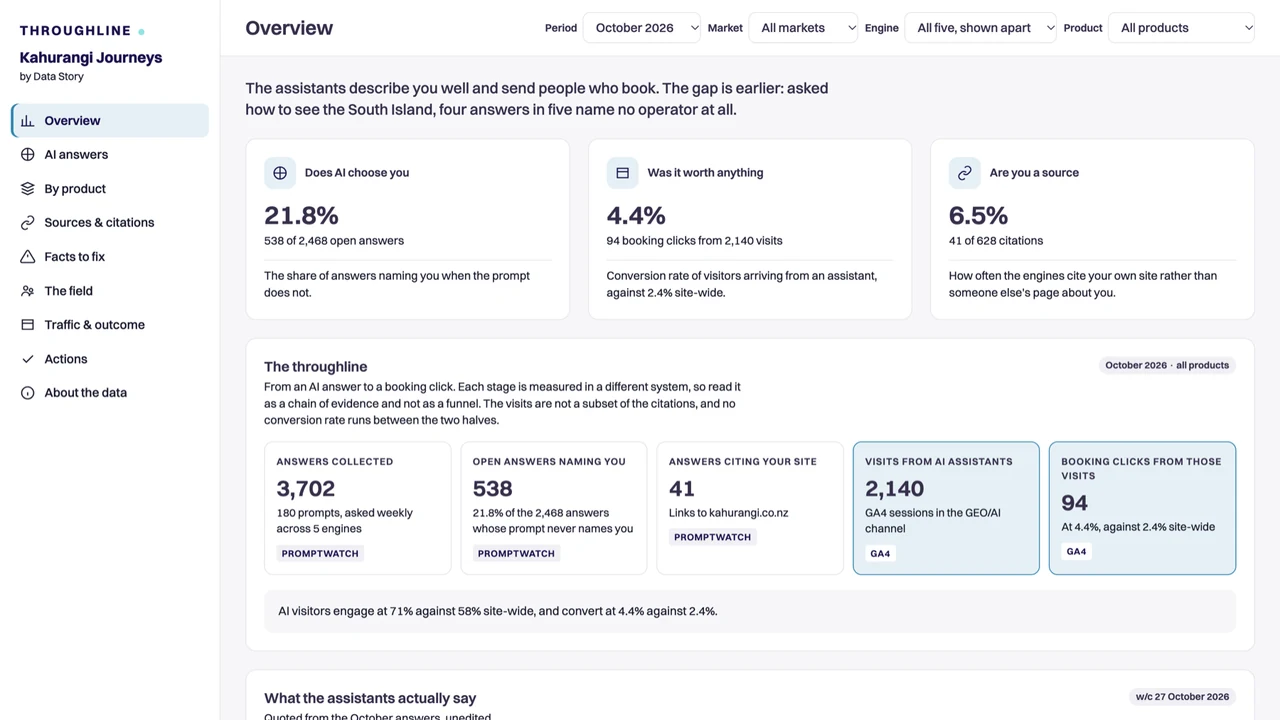
We analysed 150,421 AI answers. Here's what we learned about AI search.
2 November 2026
Six findings from 150,421 AI answers across 19 tracking projects: why small prompt libraries mislead, why brands are stable but citations churn, and what that means for your GEO strategy.
Read article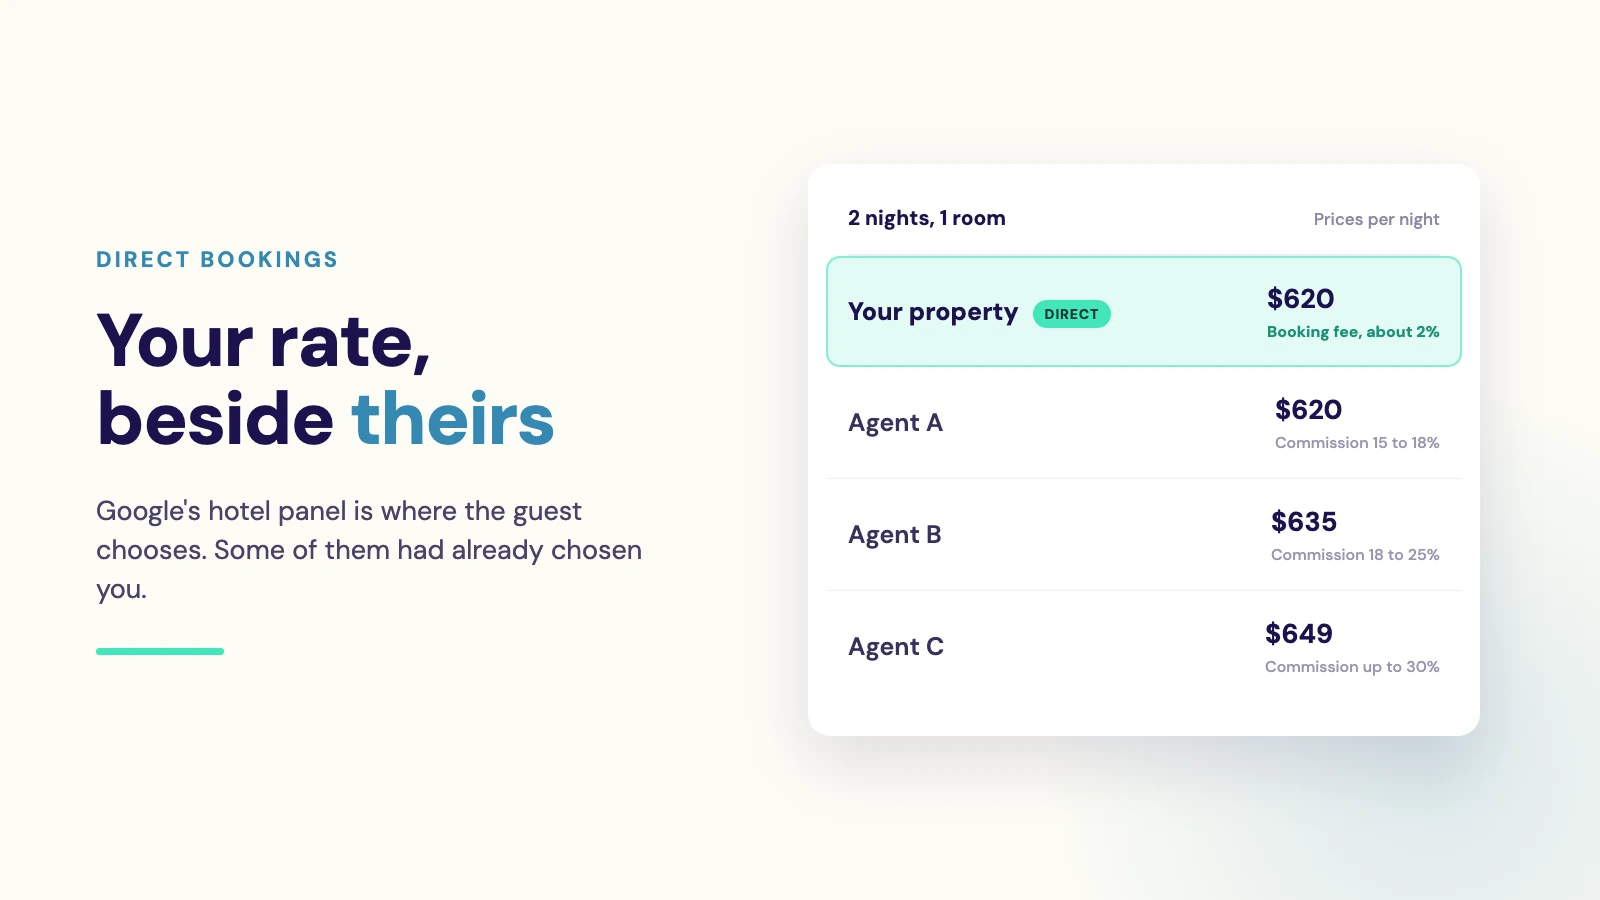
Paid Media
Why pay commission on guests you already won?
13 August 2026
Your brand, your reputation and your marketing earn the guest. Then the booking goes to an OTA, and the commission and the guest relationship go with it. How to use Google Hotel Ads to hold on to the booking, the relationship and the data.
Read article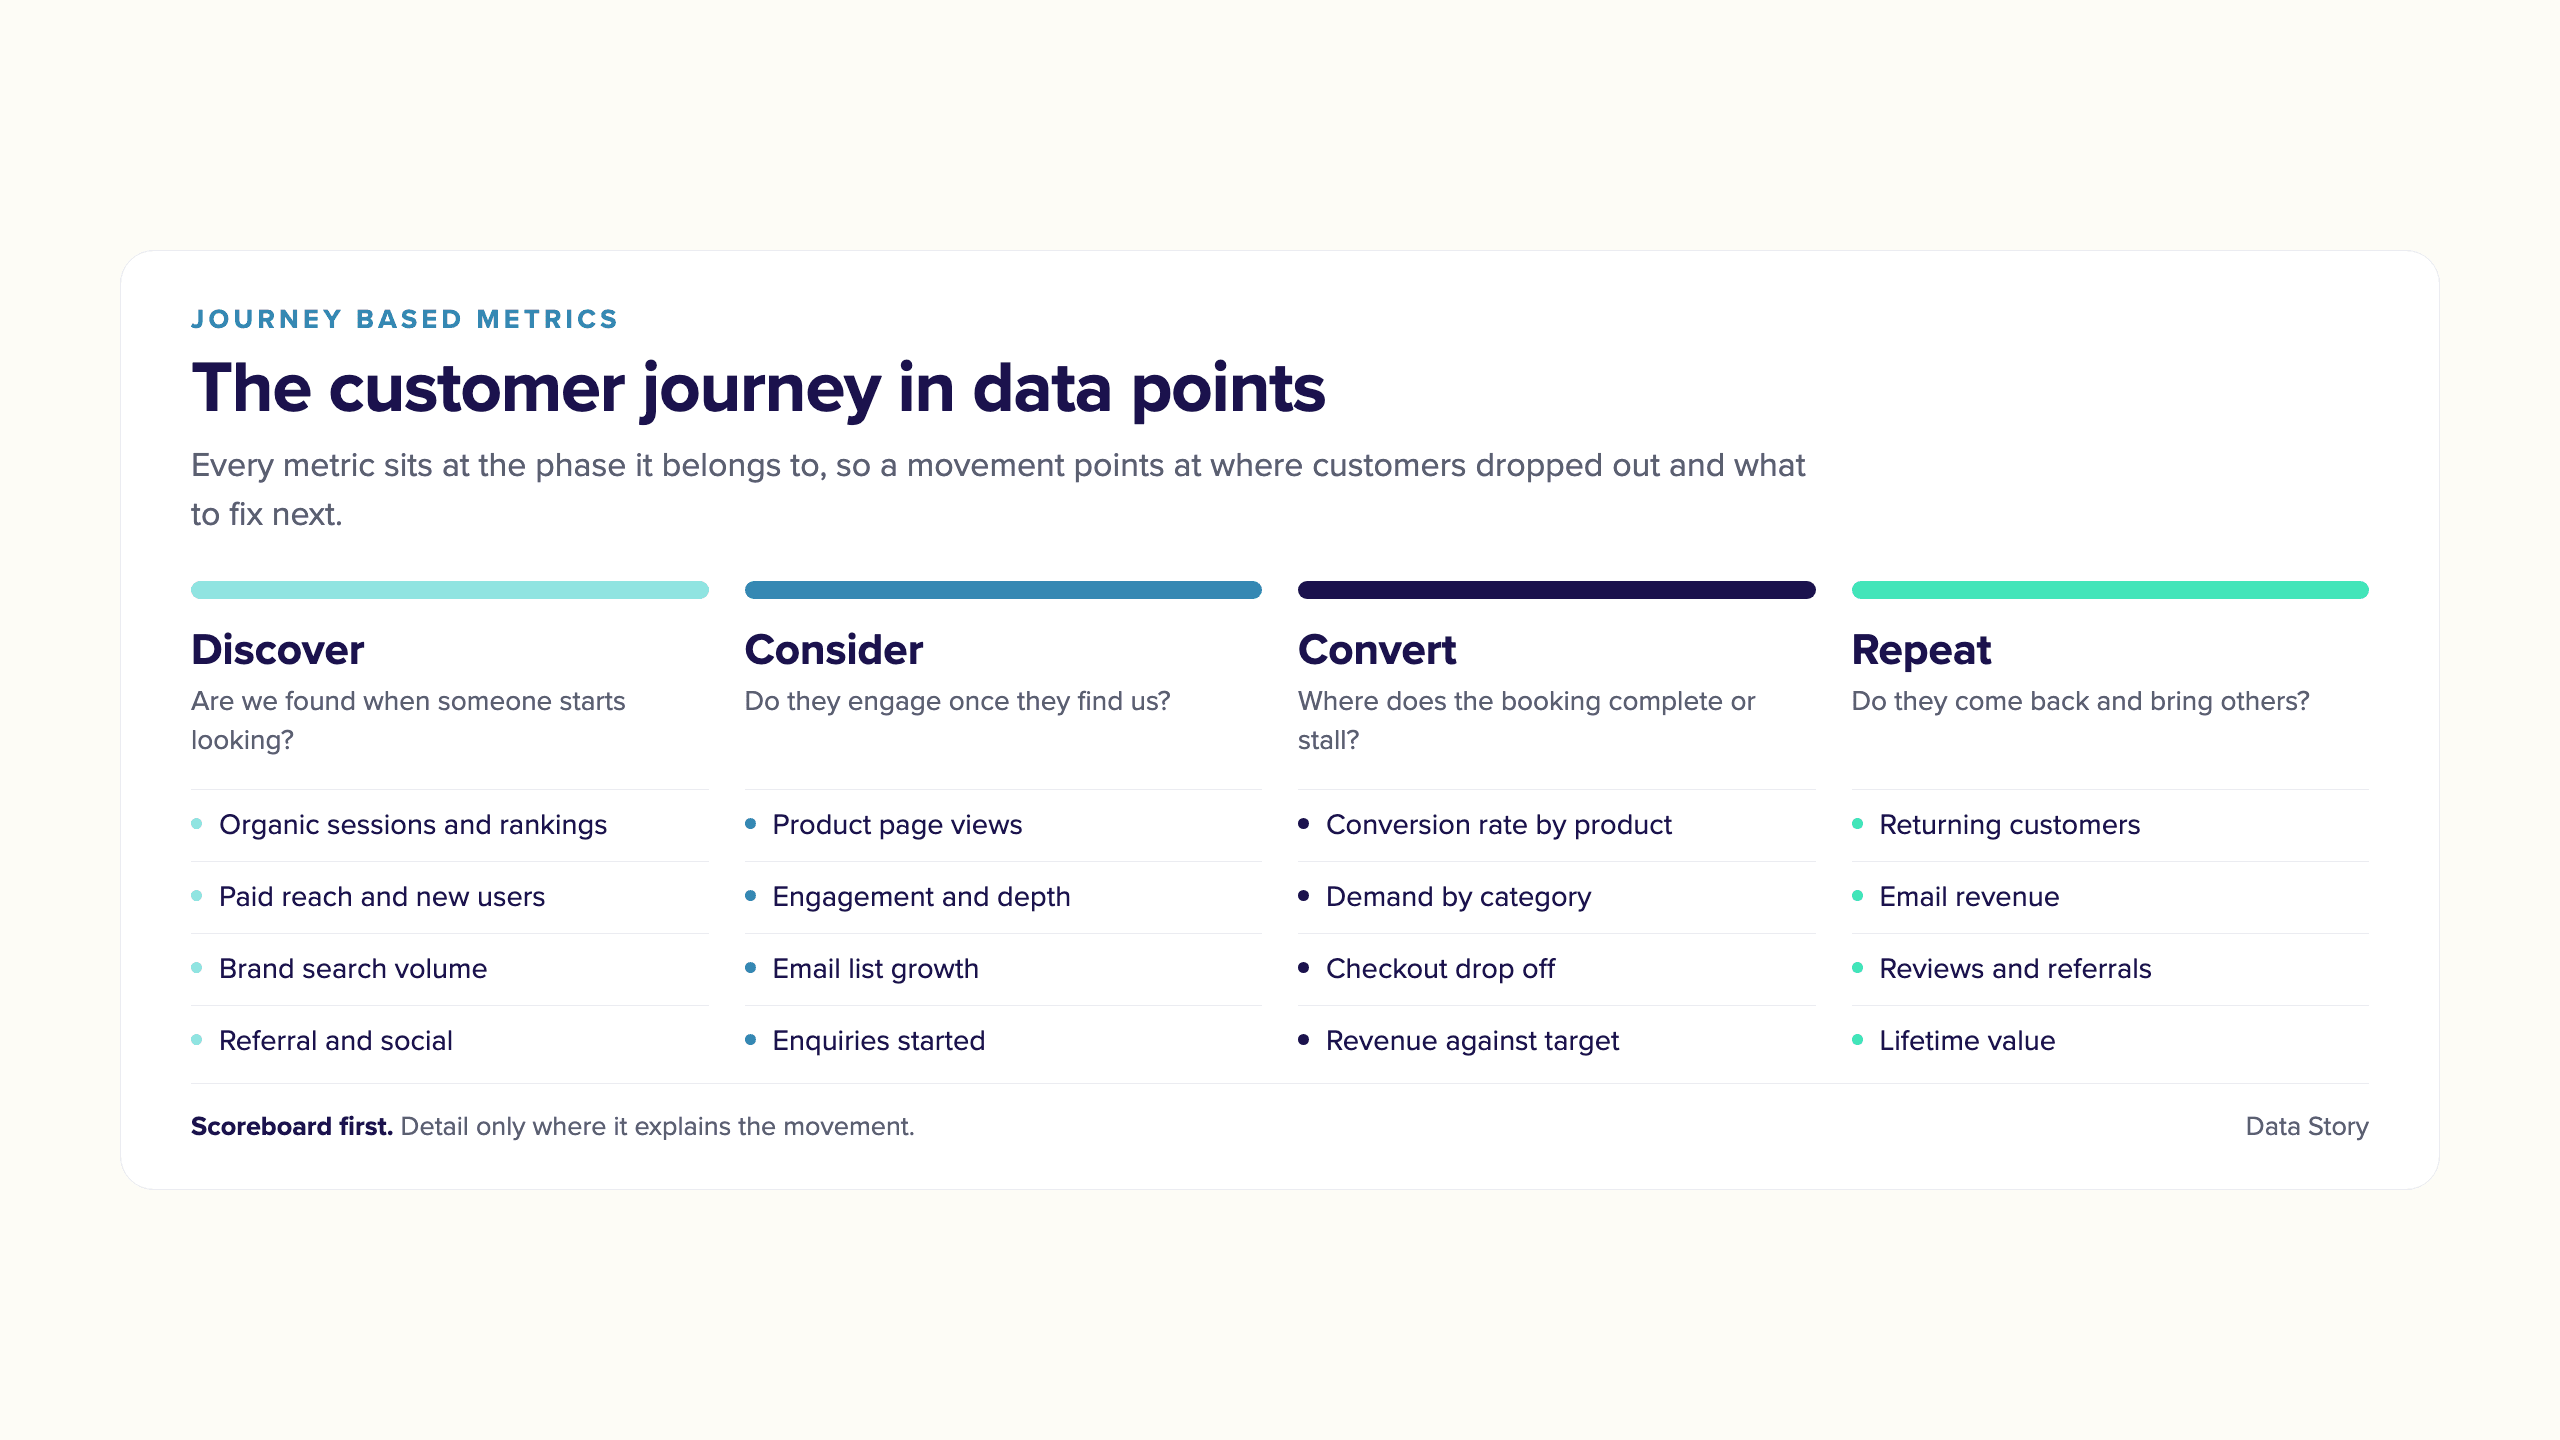
Analytics
Journey Based Metrics
11 August 2026
One client describes our reporting as her customer journey in data points, showing where growth sits and where customers drop out of the booking process. Here is what that gives a marketing team that board reporting cannot.
Read article