

Your advertising can be performing exactly as reported and still be adding very little new demand.
In 2015, researchers published the results of an experiment involving eBay. The company had switched off its branded search advertising to see what happened to the traffic those ads were supposedly generating.
Almost all of that traffic simply moved to organic search.
People were already looking for eBay. Removing the paid listing didn't stop them visiting the site. The advertising had been receiving credit for activity that would largely have happened anyway.
The researchers also tested non-branded search advertising, switching it off in some geographic markets and leaving it on in others. Again, the incremental returns were considerably smaller than attribution had suggested. But there was an important exception: newer and less frequent customers were more responsive to the advertising.
The lesson wasn't that paid search doesn't work. It was that the value of advertising depends on what it changes, not what it gets credit for.
Google reports 12x. Meta reports 3x. What would you do?
Now consider a decision marketers make all the time.
A branded search campaign delivering a 12x return on ad spend looks like an obvious candidate for more investment. A Meta prospecting campaign delivering 3x looks considerably less attractive.
But what if the Meta activity is introducing people to the business, and Google is collecting the conversions when they eventually search and purchase? Or what if Meta really is generating very little additional business?
Those are two quite different explanations for the same performance report, and they lead to opposite budget decisions.
Better tracking doesn't settle it. Server-side tracking, Meta's Conversions API and Google's enhanced conversions have made conversion data more accurate, and that work matters. But even if we could record every customer interaction perfectly, attribution still couldn't tell us one thing. Would the customer have purchased without the advertising?
Would you switch your advertising off to find out?
One of the most direct ways to answer that question makes marketers understandably uncomfortable. It's an odd thing for a paid media agency to recommend, too. We're suggesting you stop running some of the advertising we manage, knowing the result might show you should be spending less.
Imagine we proposed switching off your Meta advertising in selected Australian states for a defined period.
We'd keep Meta running normally in comparable states, hold other advertising as consistent as possible, and measure what happened to total sales. Not Meta-attributed sales. All sales.
If Meta is creating demand, removing it should affect bookings that eventually arrive through Google, organic search or direct traffic. If customers keep purchasing at much the same rate without it, we'd have reason to question how much additional business the advertising was generating.
This is a geo incrementality test, also called a geo lift test, a geo experiment or matched market testing. It doesn't depend on following individual customers across channels. It compares business outcomes between geographic markets receiving different advertising, and uses their historical relationship to estimate what would have happened without the change.
How a geo incrementality test works, in numbers
Here's an illustration with hypothetical figures.
Before the test, the states where Meta will keep running average 1,200 bookings a week. The states going dark average 1,000.
During the test, bookings in the comparison states rise 5%, to 1,260. Bookings in the go-dark states fall to 900.
A before-and-after view says bookings fell 10% when Meta was switched off. But the comparison states grew over the same period, so the fairer question is what the go-dark states would have done with Meta still running. Applying the same 5% growth gives about 1,050 bookings a week. They recorded 900.
That's 150 fewer bookings a week than expected, or about 14%.
Figure 2: Expected vs actual weekly bookings in the go-dark markets
Figure 2: Hypothetical example. The expected figure applies the comparison markets' 5% growth to the go-dark markets' baseline of 1,000 bookings. It illustrates a counterfactual, not statistical proof of incremental impact.
We wouldn't report that as 150 bookings caused by Meta. This is a simplified counterfactual, and a real analysis would use a statistical model to estimate the expected outcome, test the assumptions behind it and put a range of uncertainty around the answer. But it shows the shape of the evidence. In this illustration, bookings that would have been credited to Google, organic search and direct traffic went missing when Meta did.
Attributed ROAS vs incremental ROAS: credit and contribution are different numbers
Suppose a test like this produces an estimate precise enough to put a return on.
A campaign has been reporting $100,000 in attributed revenue from $10,000 in spend. That's an attributed ROAS of 10x.
The experiment estimates the advertising generated $30,000 in revenue that wouldn't otherwise have occurred. That's an incremental return on ad spend (iROAS) of 3x.
Neither figure is wrong. One tells us how much revenue the campaign received credit for. The other estimates how much revenue existed because of it. Only the second is a basis for deciding what the campaign is worth.
It can run the other way. A channel reporting a modest return may be creating demand that another channel collects, and its incremental return could be higher than its attributed one.
Designing a geo lift test: before anything is switched off
The hard part isn't turning the ads off. It's designing the test so the result can tell us something worth acting on.
We need markets that can be compared reliably, enough sales volume to detect a meaningful difference, outcome data we can trust, and a test period that reflects how customers actually buy. We also need to be honest about the cost. Going dark may mean losing some bookings while the test runs.
And we need to agree on something else in advance. What would we do differently depending on the answer?
- If total sales fall meaningfully without Meta, cutting it would be a mistake, whatever its attributed return says.
- If sales barely move, and the test was sensitive enough to detect a change that matters, there's a case for spending less or moving the budget.
- If the result is inconclusive, we say so. An unclear result isn't proof the advertising doesn't work.
That's the point of running it. Not to produce another performance metric. To make a better investment decision.
Geo go-dark, holdback and heavy-up tests: the practical details
Three test designs. A go-dark test switches existing advertising off in selected markets and asks what current activity is adding. A holdback test runs new advertising in some markets and withholds it from others, to evaluate it before a wider rollout. A heavy-up test increases investment in selected markets to see whether more spend earns enough additional return. These follow Google's guidance on geo experiments.
When a test is likely to be viable. A geo test has a better chance of giving a usable answer if:
- You advertise across enough separate markets to form comparable groups.
- Each group produces enough weekly sales or bookings for a realistic change to stand out from normal variation.
- You can measure the outcome by location, independently of the advertising platforms.
- Your purchase cycle is short enough to see the effect within a practical test window.
- Your advertising can be reliably targeted or excluded by geography.
In smaller markets. Australia and New Zealand have fewer large, independent markets than the United States, and dividing them further can leave little conversion volume in each group. That doesn't rule a test out, but it's why we wouldn't recommend a duration, a market split or a minimum detectable effect before looking at the actual data. Where a geo test isn't viable, a platform conversion lift study or marketing mix modelling may be a better fit.
If you're a destination or RTO
A regional tourism organisation doesn't take the booking, so the outcome has to be measured somewhere other than its own sales. That usually makes outcome volume the binding constraint on a geo test, ahead of the number of markets available.
Three measures are worth checking:
Outbound referrals to operators. These are the most practical to collect and can be assigned to an origin market. A referral records intent, and some of those travellers will book elsewhere or not travel at all. Confirm the outbound click event fires consistently across the site before building a test on it.
Bookings by customer origin, aggregated across participating operators or trade partners. This is the strongest measure and the slowest to arrange, because coverage only extends to the businesses that take part. Start those conversations early.
Airline passenger counts. These work as a proxy for arrivals, though they include residents and travellers heading elsewhere, and they can be slow to report. Check what the data counts before designing a test around it.
Is a geo incrementality test right for your business?
At Data Story, we help businesses in New Zealand and Australia improve the accuracy of their marketing measurement and understand what their advertising contributes. We start with the decision you're trying to make and work backwards to the evidence needed to make it.
A first conversation covers three things: the markets you advertise in, the sales data you hold by location, and whether a test could detect a change that would alter your budget.
Frequently asked questions

Written by
Hannah Stuart
Head of Strategy
Hannah leads strategy at Data Story, working with clients to turn marketing data into growth roadmaps. She brings deep experience in full-funnel digital strategy, attribution modelling, and performance marketing across New Zealand and Australian markets.
LinkedInRelated articles

Paid Media
Consistent campaign names let you compare every ad platform at once
4 November 2026
The same creative runs on Meta, Google and TikTok, but each account reports on its own. A shared naming convention gives every campaign, ad set and ad common fields, so you can compare a creative, a market or all your awareness campaigns across platforms.
Read article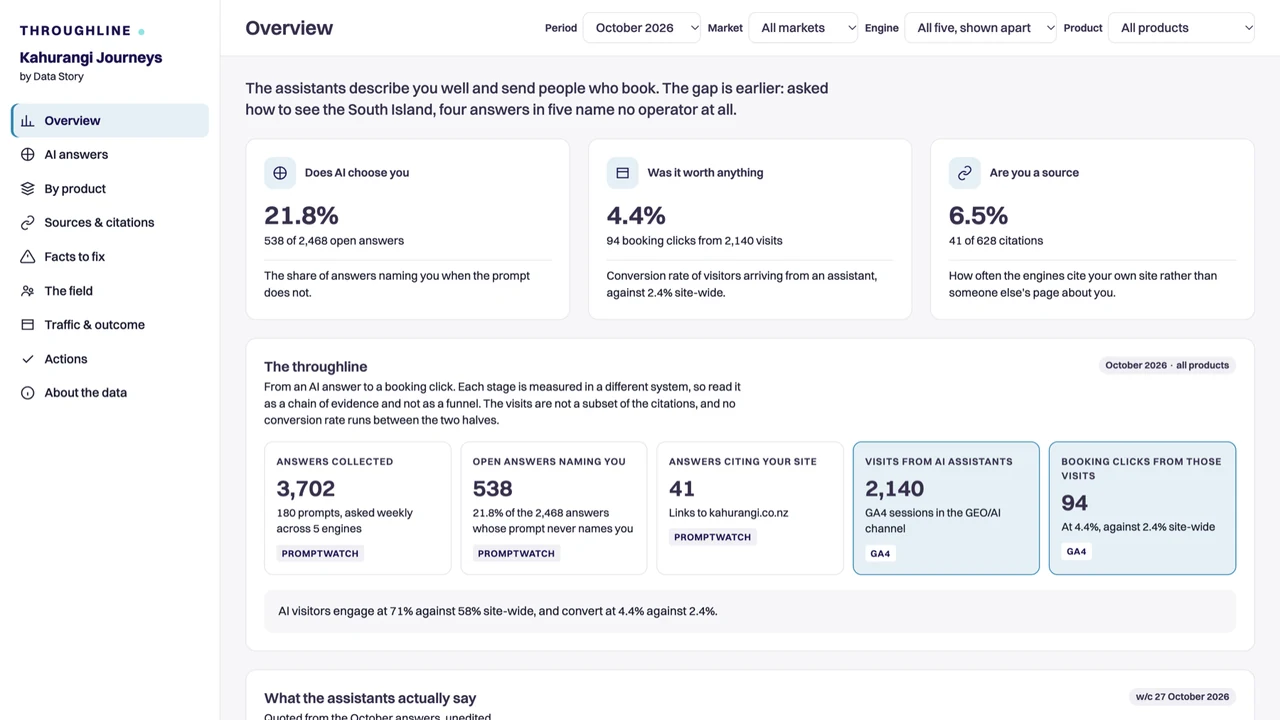
SEO & GEO
We analysed 150,421 AI answers. Here's what we learned about AI search.
2 November 2026
Six findings from 150,421 AI answers across 19 tracking projects: why small prompt libraries mislead, why brands are stable but citations churn, and what that means for your GEO strategy.
Read article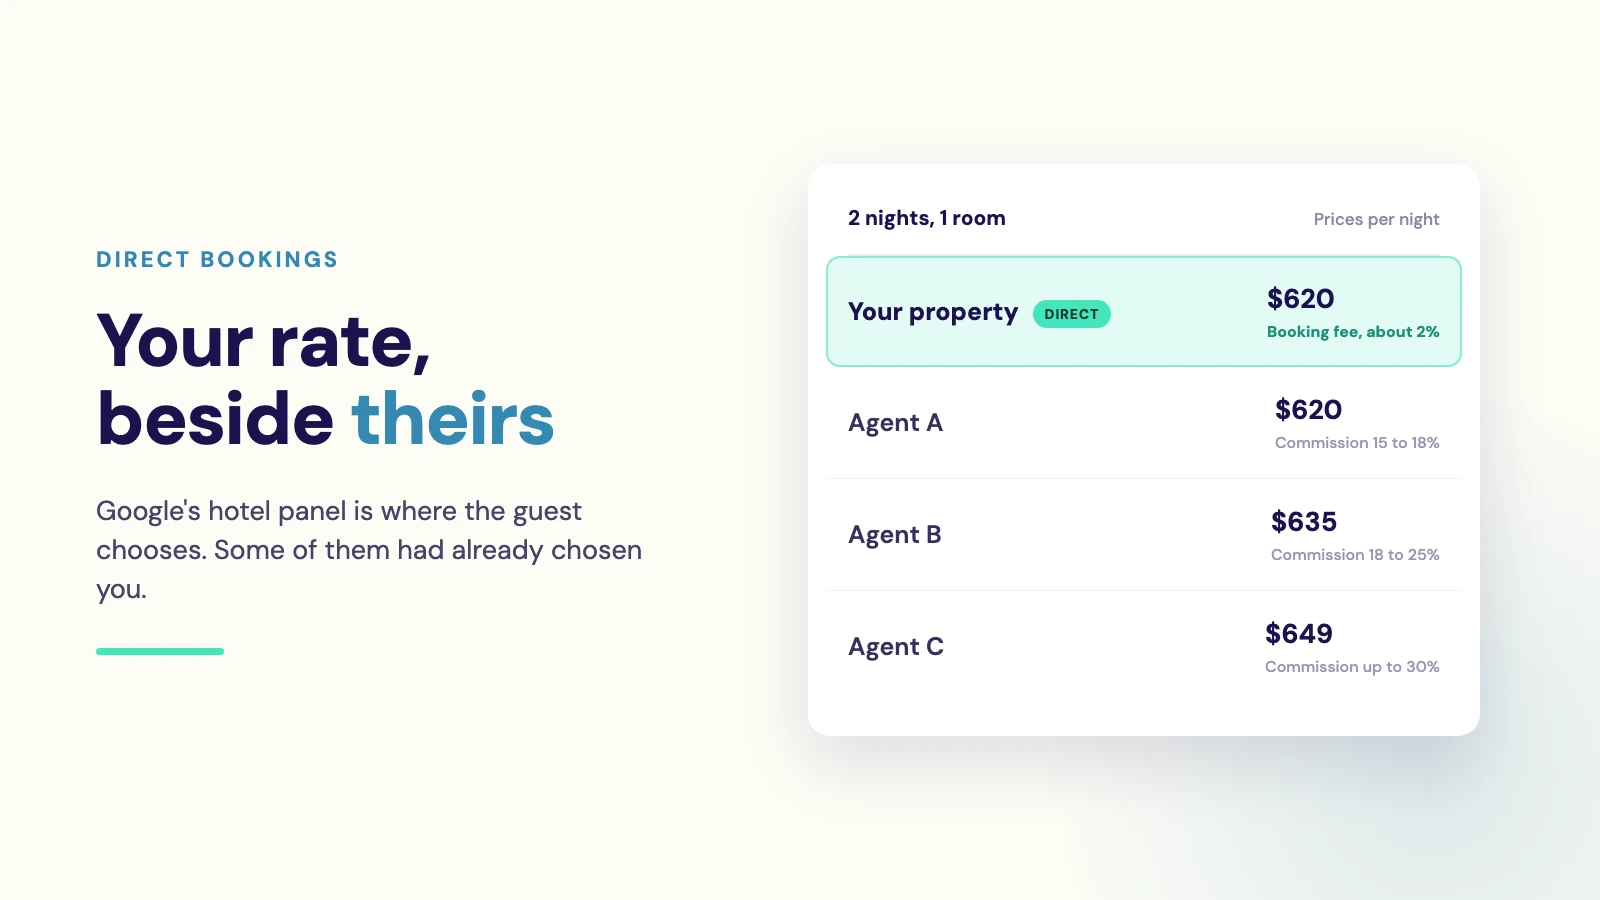
Paid Media
Why pay commission on guests you already won?
13 August 2026
Your brand, your reputation and your marketing earn the guest. Then the booking goes to an OTA, and the commission and the guest relationship go with it. How to use Google Hotel Ads to hold on to the booking, the relationship and the data.
Read article