
Journey Based Metrics
You have the numbers. What is harder is knowing which part of the customer journey needs attention. Journey Based Metrics gives every stage an agreed measure and a benchmark, so performance can be assessed rather than only reported.
A number becomes useful when you know what it should have been
Reporting usually tells you what happened and how it compares with last year. That is enough to describe performance and not enough to judge it, because nothing in it says what the figure needed to be.
Journey Based Metrics adds the missing half. Each stage of the journey carries a measure your team has agreed, a written definition of what it counts, and a benchmark drawn from your own history or your goals. The reporting then says not only what moved, but whether it moved enough.
One objective, across the journey
Grow direct bookings without paying more commission
Illustrative, not a real client
| Dream | Non-brand organic sessions | 42,100 | Prior year | 12% below |
| Paid reach, target markets | 1.84m | None agreed | Tracked, not assessed | |
| Plan | Booking page views | 18,400 | Prior year | 4% ahead |
| Availability checks | 6,210 | Prior year | Recorded from 1 Aug, not yet comparable | |
| Book | Direct bookings | 386 | Annual goal | 9% short of goal |
| Commission share of bookings | 54% | Annual goal | 4 points above goal | |
| Retain | Repeat booking rate | — | Not measured | Gap in the map |
Where momentum is changing
Discovery is down while the stages after it hold. That points at Dream first, though one of its two measures has no agreed benchmark, so the read is partial.
Where there is room to grow
Bookings are short of goal while the booking page runs ahead of last year. The constraint looks like volume reaching that page rather than the page itself, which is a cheaper problem to fix.
What clients get today
The framework is the part you own. It outlives a change of platform, dashboard tool or agency, because it is a set of decisions about what you measure and what counts as good.
An agreed map of your journey
The stages your customers actually move through, named with your team, so everyone is assessing the same thing.
A defined metric for each stage
Each one written down: what it counts, what it excludes, and where it will differ from the platform it came from. Settled once, not re-argued monthly.
A benchmark wherever one can be agreed
Your annual goals, your own history, or a relevant reference point. Where a measure has no benchmark yet we mark it as tracked rather than invent one, because a comparison nobody has agreed to is not an assessment.
A workbook, refreshed daily
A headline view for a board, a tab per stage, and two tabs showing where the data disagrees with your source systems and whether it arrived at all.
From reporting to knowing where to look
Each reporting period your team opens one shared view of how the journey is performing: where momentum is changing, which measures are tracking against their benchmarks, and where there may be room to grow.
A monthly marketing meeting then starts on the parts of the journey that deserve attention, rather than on working through a report from each platform and arguing about which figure to believe.
It does not replace the investigation that follows. It gives that investigation a starting point, and a record of what everyone agreed to measure when the question comes up again next quarter.
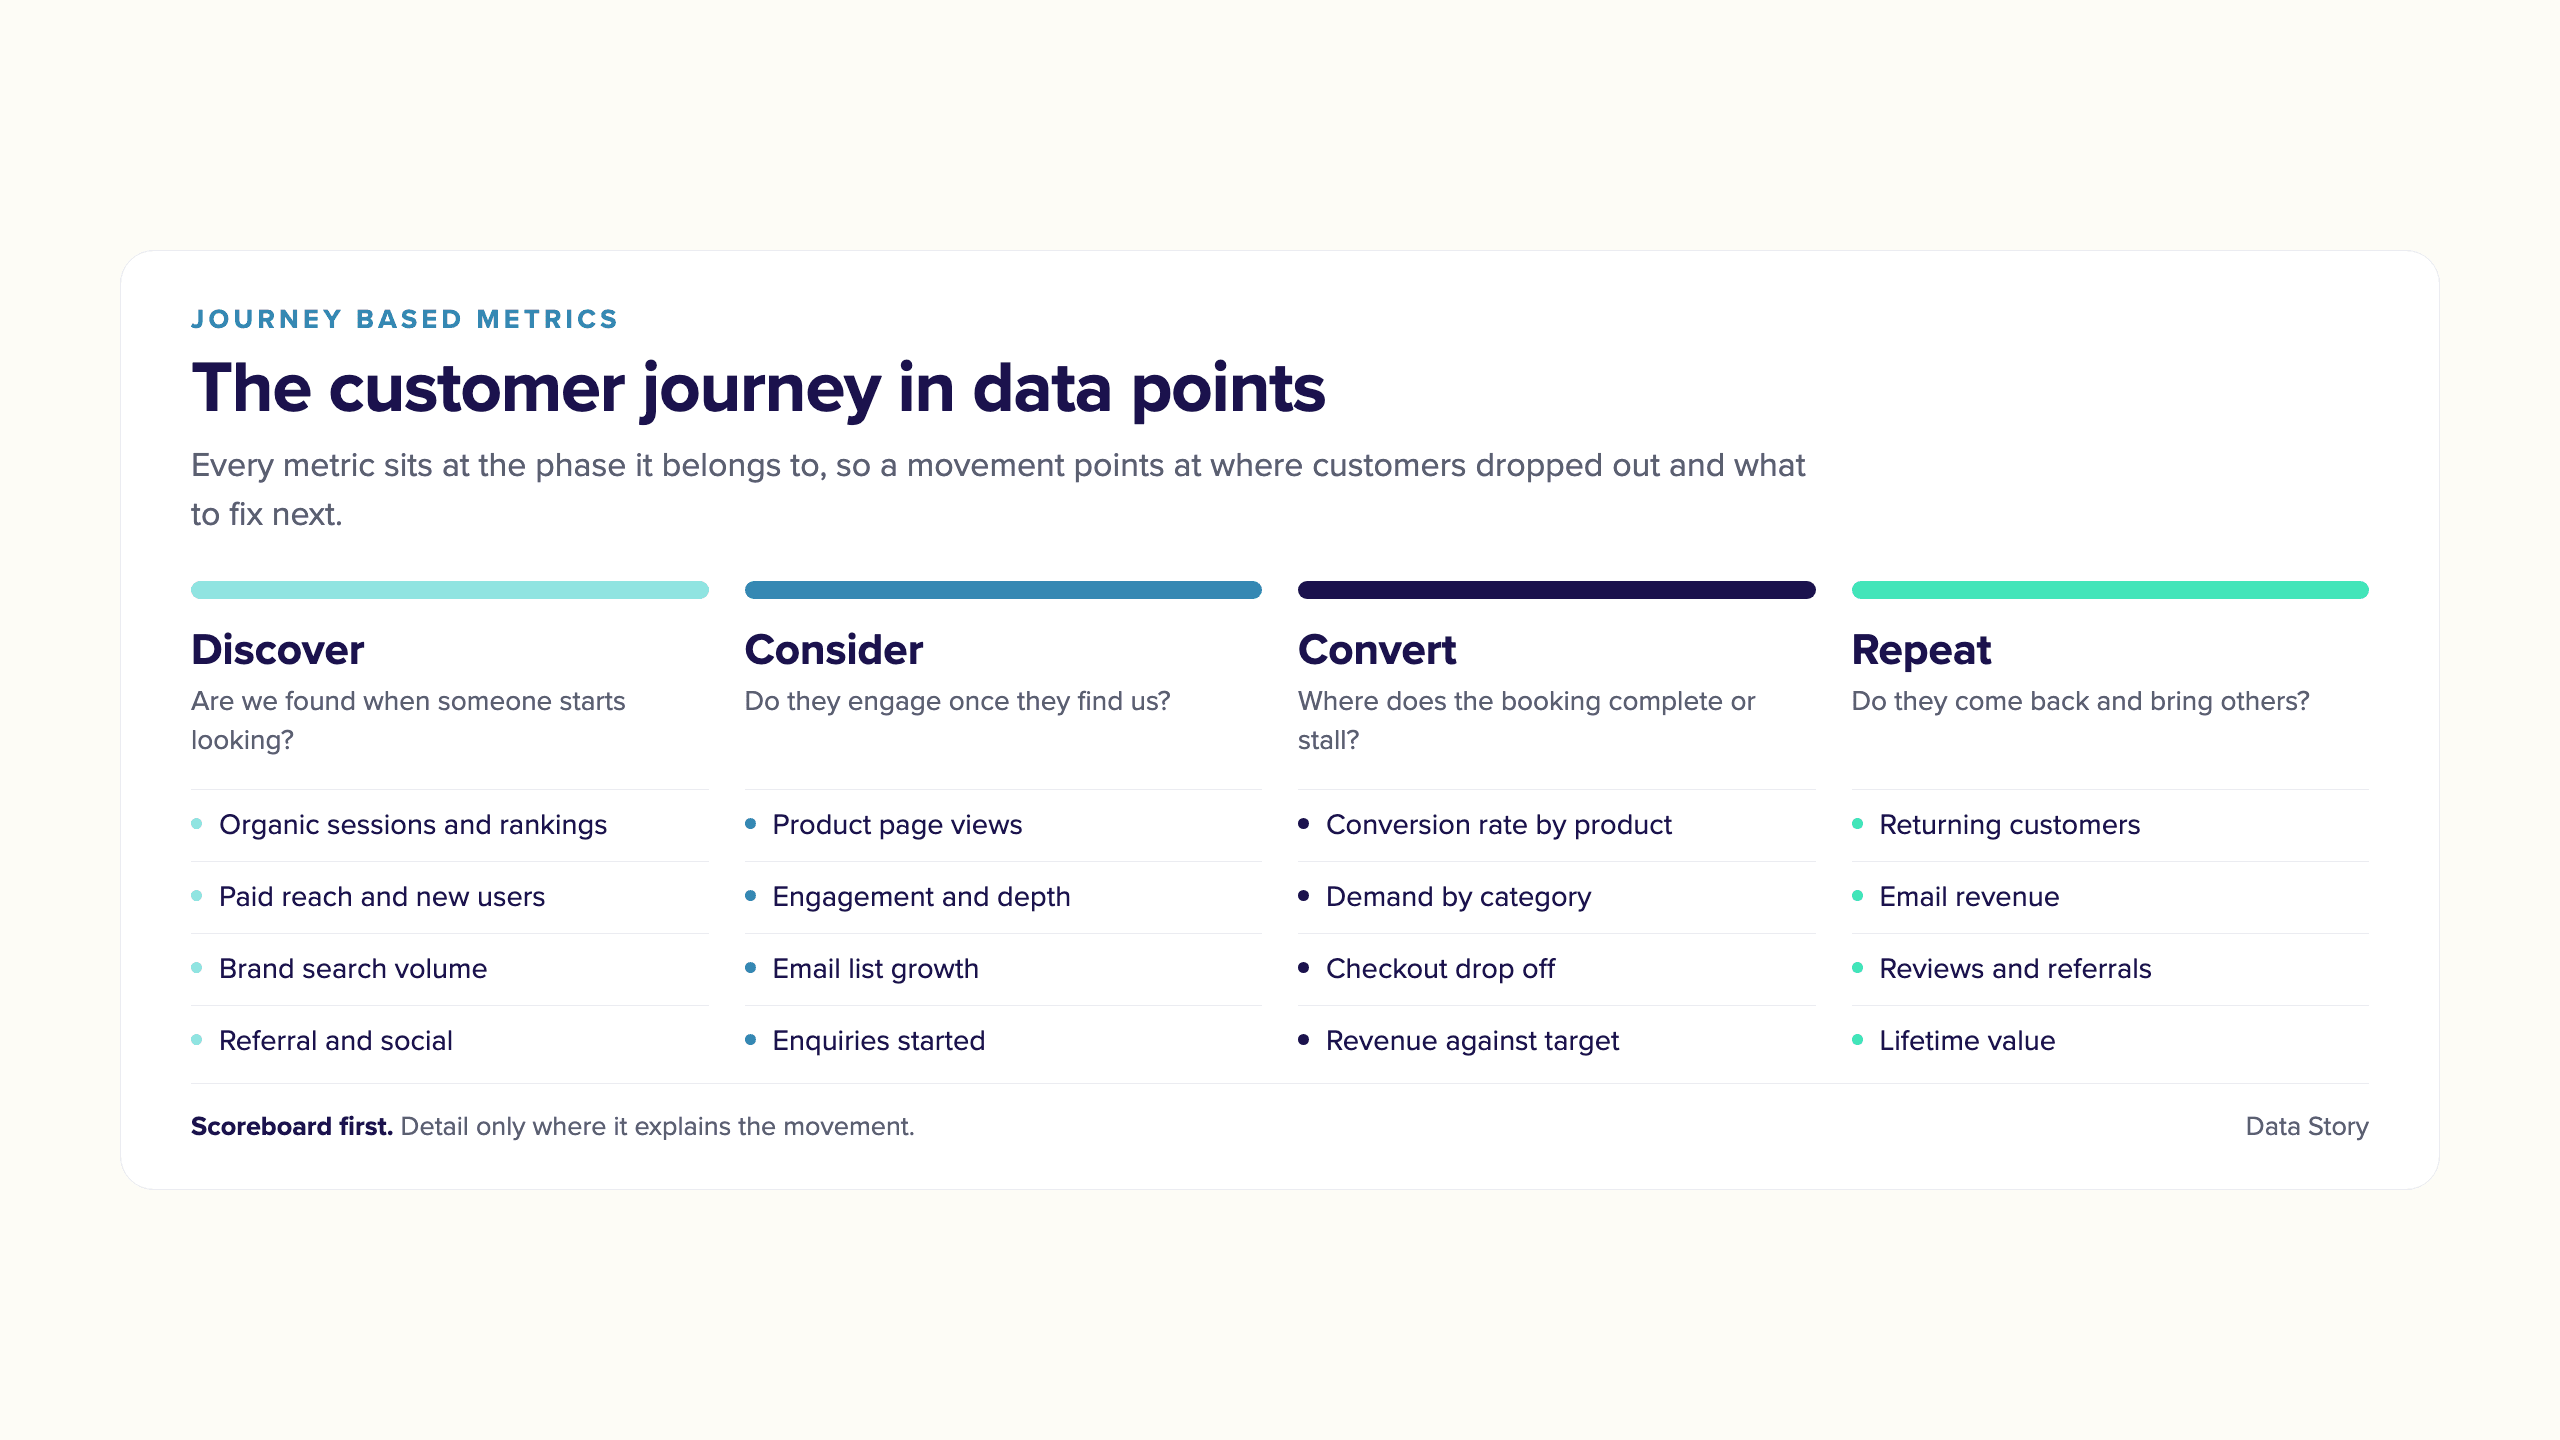
One client describes it as her customer journey in data points, showing where growth sits and where customers drop out of the booking process.
It points, it does not diagnose
A framework that told you why a stage was underperforming would be a better product and a worse promise. Journey Based Metrics shows you which measures sit furthest from their benchmark, which are holding, and which have no benchmark yet. Working out the cause is the job that follows, and it usually needs evidence the reporting cannot hold on its own.
What it narrows is how much of the conversation is opinion. People can still disagree about a benchmark or read a partial series differently, and that is a better argument to be having than one about whose number is right.
Knowing where to look is most of the value, and it is the part almost no reporting provides.
Frequently asked questions
How we think about measurement
Analytics
Journey Based Metrics
11 August 2026
One client describes our reporting as her customer journey in data points, showing where growth sits and where customers drop out of the booking process. Here is what that gives a marketing team that board reporting cannot.
Read article
Destination and Experience
The tourism journey is too long to measure by gut
16 July 2026
Read article
Customer Journey
You can't do good marketing with AI until your data is organised for it
16 July 2026
Read articleWhich stage of your journey needs attention?
If your reporting tells you what happened but not whether it was good enough, that is the gap this closes. We will walk you through what the framework would look like on your own journey.