Data Story
Bringing marketing data together to make better decisions
Analytics · Data Strategy
November 2026
In 2026, we rebuilt how we bring our clients' marketing data together. Each client now has a separate Google BigQuery data environment, updated every day. The result is less time spent assembling reports, and more time spent understanding what is driving performance.
Useful data, reported in separate places
Our clients' customers may discover a business through search or social media, return to its website several times and make a decision much later. Google Analytics, Google Ads, Search Console and Meta each provide useful information, but report on different parts of that activity.
When we reviewed these figures separately, it was harder to judge the contribution of different channels and where further investigation might be worthwhile.
Comparing performance across platforms meant manually exporting, aligning and checking figures before the analysis could begin.
Different attribution methods, metric definitions and historical reporting limits added complexity, particularly when comparing results over several seasons.
A separate data environment for every client
We started designing a new data foundation in April 2026. We built it for one client first, from end to end, before moving to the next. The first four clients were live by the middle of May, and every client since has been set up the same way.
For each client, we set up a separate Google BigQuery data environment that brings together data from the platforms we use for measurement.
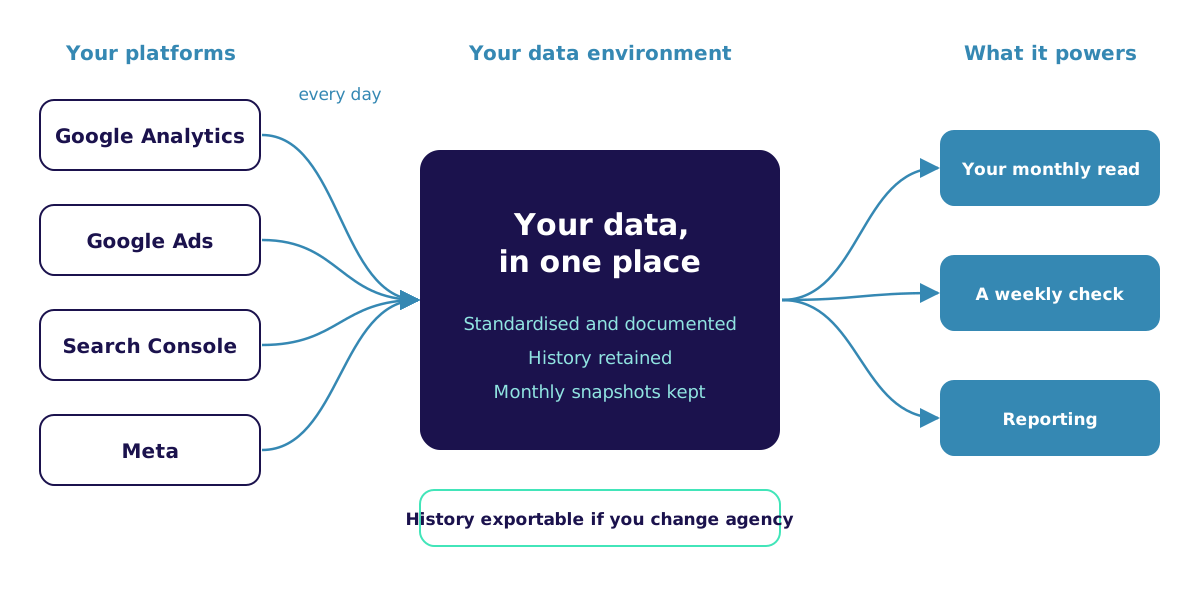
We automated daily imports from Google Analytics, Google Ads, Search Console and Meta, subject to the availability and refresh schedules of each source.
We standardised and documented the measures used in reporting, while retaining historical data for comparisons over time. We still account for differences in how each platform measures results.
Where the data supports it, we grouped relevant measures around stages of the customer journey, from awareness and research through to purchase and repeat engagement. This helps structure conversations about performance, rather than claiming we can track every person from start to finish.
We retain monthly reporting snapshots, making it possible to refer back to the figures used in earlier reports if a platform later restates its data.
What it lets us do with our clients
Compare the signals at different stages of the journey.
This helps us identify where performance has changed or where a closer look could reveal an opportunity.
Investigate changes with the relevant data already prepared.
That gives us more time to test possible explanations, rather than assuming a change in one metric tells the whole story.
Agree on an action and the measures that should respond.
We then review the results, recognising that seasonality and other changes can also affect performance.
Checked every week and every month
Our weekly checks flag unusual movements in tracking, campaign spend and incoming data relative to each client's usual patterns. They support earlier investigation, but do not replace regular tracking audits or guarantee that every issue will be detected.
We check monthly reporting against its source platforms and investigate material differences. In one recent check, a client's revenue matched Google Analytics to the cent. Where definitions or attribution models differ, we explain that rather than forcing the numbers to match.
A repeatable setup gives us a consistent foundation, while leaving room for each client's tracking, commercial goals and reporting requirements.
What our clients get from it
Since the first clients went live in May 2026, the setup has changed how we work with them.
- Less manual effort assembling cross-channel reports, and clearer definitions for the figures used in decisions.
- A longer reporting history that helps put seasonal performance and changes in demand into context.
- Access to an export of their historical reporting data if they change agencies, with the handover scope agreed in advance.
- The ability to compare platform-reported results with wider website and business measures, while recognising that attribution remains imperfect.
What we need from a new client
We need appropriate access to the platforms included in your reporting. We establish this early and agree the scope of the data we will use.
Where another provider manages tracking or existing integrations, we coordinate with them to avoid disrupting that work.
If you're finding it difficult to compare marketing performance across channels or explain what is driving results, talk to us about your measurement and reporting setup. We can discuss whether a more connected approach would be useful for your business.
Ready to scale your marketing?
Let's grow your business and reach your digital marketing goals. Let's do this together.
Book a Free Strategy Call